Sell in May and go away is an investment theme on the mind of many investors right now. Given how stocks have behaved the last three years, it is easy to see why. Adding support to this idea is the fact that economic fundamentals are also continuing to deteriorate into what is increasingly looking like another spring swoon. But with so many investors calling for a pullback in stocks over the next several months, it raises the following question from a contrarian perspective: will it make sense to "sell in May and go away" once again this year, or will investors be better served to "buy in May and stay to trade"?
One has to look no further than the pages of Seeking Alpha for scores of excellent fundamental arguments as to why we should see the stock market fall into correction over the next few months. I even wrote an article on the topic a few weeks ago. And I continue to contend that such a stock market correction would be healthy in that it would work off some of the froth that has accumulated during the rally since last November.
Despite all of the evidence supporting the idea of a stock market sell-off in the coming months, it may end up not coming to pass in any meaningful way this year. Instead, we may continue to see stocks climbing to new heights, even as the economic backdrop continues to deteriorate. Why? The relentless stimulus efforts from our global central banks.
One key fact differentiates this year from the past three years. In 2010, 2011 and 2012, a major central bank was ending a massive stimulus program at this time of year.
In 2010, the Fed's QE1 program came to an end on March 31, 2010, and the spring swoon in the stock market quickly followed a few weeks later in April.
In 2011, the Fed's QE2 program was set to expire on June 30, 2011. Stocks thrashed about for months in anticipation of this program ending. And once it finally concluded, stocks plunged off a cliff a few weeks later in July.
In 2012, the European Ce! ntral Bank completed its LTRO program on February 28, 2012. And it was not long after the completion of this program that stocks fell into correction starting at the very beginning of April.
Juxtapose the last three years versus 2013. No major stimulus program is coming to an end today. And any talk about the Fed tapering off their asset purchase program by the end of the year is very premature, as I expect instead that they will be maintaining if not increasing their asset purchase program well into the future. Helping fuel the monetary blaze in 2013 is the Bank of Japan, which has jumped on board with an asset purchase program of their own that is so aggressive relative to the size of their economy that it makes those at the Fed look like a bunch of hawks. And on Thursday, the European Central Bank threw the latest log on the fire with a quarter point rate cut to go along with the market's belief (whether misguided or not) that the OMT program is ready at the first signs of any trouble.
So unlike the past three years when the monetary flames were being extinguished, global central bankers from around the world are collectively working the bellows to fuel the fire today. And this has critically important implications for financial markets as we move through the typically challenging May to October period.
Over the last 30 years, the average return on the S&P 500 Index (SPY) during the May to October period has been a mostly unexciting +1.27%. But these overall results obscure the tumult that often occurs along the way. For over the past three decades, stocks as measured by the S&P 500 Index have experienced peak to trough corrections at some point during the May to October period that average -13.50%. It is worth noting that the median of declines over this period is also a meaningful -10.39%.
(click to enlarge)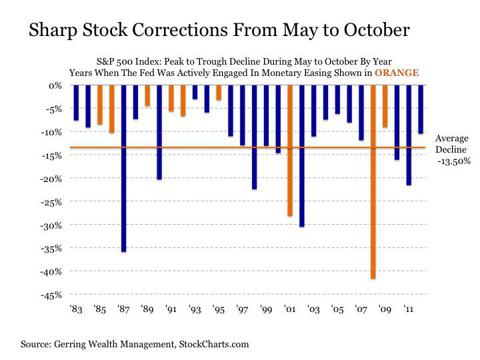
Therefore, experiencing so! me sort o! f correction as we move through the coming months should not come as a surprise. The question instead is the magnitude of the decline. And this is where monetary policy comes in to play.
On nine separate occasions over the past 30 years, or 30% of the time, the U.S. Federal Reserve has been actively engaged in easing monetary policy heading into the May to October period. These are the orange bars on the above chart. On seven of these nine past occasions, the stock market correction during these periods was below average including four of the seven instances where the peak to trough decline was less than -7%. Moreover, stocks exceeded the average return of +1.27% during this overall time period from May to October in seven of the nine years when the Fed was applying stimulus including three of the best five returning years over the last three decades.
(click to enlarge)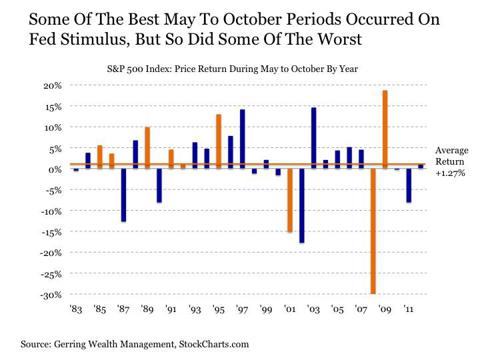
Thus, it is reasonable to think that we may see stock market performance that exceeds expectations in the coming months even if the global economy continues to deteriorate along the way thanks to the steaming hot printing presses of global central banks. And as Fed Chairman Ben Bernanke stated himself, they stand ready to pump even more liquidity into the markets at the first hints of any trouble. The following is Bernanke's response to a question by Greg Robb from MarketWatch at the March 20 FOMC press conference (thanks to SA commenter jhooper for providing this link in a past article).
GREG ROBB: There's been a trend in the last couple of years where the economy kind of jumped out of the gate in the first part of the year only to kind of falter. Is that something that you're worried about this year? And does that suggest that QE might have to stay kind of at the same pace you are now and some into the third quarter until we're sure about that - that trend?
CHAIRMAN BERNANKE: Well! , you're ! absolutely right that there's been a certain tendency for a spring slump that we've seen a few times. One possible explanation for that - besides some freaky things, some weather events and so on, one possible explanation is seasonality. Because of the severity of the recession in 2007 to 2009, the seasonals got distorted. And they may have led - and I say "may" because the statistical experts - many of them deny it, but it's possible that they led job creation and GDP to be exaggerated to some extent early in the year. Our assessment is, though, that at this point, that we're far enough away from the recession that those seasonal factors ought to be pretty much washing out by now. So if we do, in fact, see a slump, it would probably be due to real fundamental causes and then we would obviously have to respond to that. As I said, we're planning to adjust our tools to respond to changes in the outlook, and that can go either direction.
So while global central banks remain largely blind to the fact that the course of current policy has yet to generate sustainable economic growth, they are keenly aware of the forces that seem to have caused markets to start unraveling in the past and have shown eagerness to adapt by anticipating future shocks and providing even more support at a moment's notice when deemed necessary. As a result, if we see any signs of stock market weakness in the months ahead, we can be certain - barring +$5 per gallon gasoline at the pump - that the Fed will be rushing in with more monetary doping, even if the stock market is down sharply for just a day or two, as they have seemingly become that sensitive to any type of decline at this stage.
Despite these reasons for stock market optimism, regardless of whether it is fleeting if not altogether false, two things should stand out on the charts above. These are the years of 2001 and 2008. Just like the other seven years, the Fed was easing policy during these periods. But in sharp contrast to the other years, the gene! rosity of! global central banks including the Fed could not overcome the downside pressure on shares during these specific time periods, as these two years rank among the four worst performing on record with sharp and sustained double-digit declines.
This brings us to the primary risk associated with buying stocks primarily on the belief that the Fed and global central banks will always be there to save the day. Sometimes the underlying problems plaguing the global economy and its markets are so pronounced that no amount of monetary support can offset the increasing destabilization. Therefore, if conditions reach the point where things either begin to unravel or are so far disconnected from underlying fundamentals, capital markets may force the issue and correct sharply regardless of whatever global central bankers decide to do. This is a underlying risk that mounting by the day and should be monitored closely, for if and when markets begin to break, they are likely to do so quickly and sharply given the level of margin debt outstanding and the widening difference between stock market prices and economic reality.
After taking these risks into consideration, maintaining an allocation to stocks remains worthwhile in such an environment. Given the volatility that often accompanies the turbulent May to October period, it may offer some particularly good trading opportunities as either broader markets or specific securities experience steep corrections followed by swift rallies. But risks must be monitored closely and holdings should be viewed with a potentially shorter time horizon depending on how events unfold in the coming months. Emphasizing stocks that exhibit quality, low volatility, value and current income that are also not technically overbought provides an additional way to control risk in the current environment. This includes allocations such as the Vanguard Dividend Appreciation ETF (VIG) and high quality individual names such as ExxonMobil (XOM), International Business Machines (IBM), McDona! ld's (MCD! ), General Electric (GE) and Oracle (ORCL). It should be noted that IBM, General Electric and Oracle were all positions that were scooped up following recent sharp pullbacks.
It also remains worthwhile to hedge stock allocations to protect against any major downside event along the way. This includes positions with low correlations such as the PIMCO Total Return ETF (BOND) or the PIMCO Global Advantage Inflation Linked Bond ETF (ILB). This also includes allocations that are likely to rally sharply in the event of a stock pullback but can also continue to rise along with the market such as long-term Treasuries (TLT) or Build America Bonds (BAB). And despite the recent thrashing they have endured, the precious metals complex including gold (GLD), silver (SLV), platinum (PPLT) and palladium (PALL) continue to provide attractive long-term portfolio diversification benefits. I remain long all of these metals via the Central GoldTrust (GTU), the Central Fund of America (CEF), the Sprott Physical Silver Trust (PSLV) and the Sprott Physical Platinum and Palladium Trust (SPPP).
Disclaimer: This post is for information purposes only. There are risks involved with investing including loss of principal. Gerring Wealth Management (GWM) makes no explicit or implicit guarantee with respect to performance or the outcome of any investment or projections made by GWM. There is no guarantee that the goals of the strategies discussed by GWM will be met.
Disclosure: I am long XOM, IBM, GE, MCD, ORCL, VIG, TLT, BAB, BOND, ILB, GTU, CEF, PSLV, SPPP. I wrote this article myself, and it expresses my own opinions. I am not receiving compensation for it (other than from Seeking Alpha). I have no business relationship with any company whose stock is mentioned in this article. (More...)
No comments:
Post a Comment