Saturday, August 31, 2013

Subscribe to HUDCO tax free bonds issue, says ICICIdirect

"HUDCO has come out with tranche II of the tax free bond issue after having collected Rs 2215 crore in tranche I in January 2013. The tranche II tax free bond carries an annualised coupon of 7.53%and 7.69% for retail investors for tenure of 10 years and 15 years, respectively. Interest received on the bond is fully exempt from income tax. The pre-tax yield on the bond for the highest tax bracket investors, therefore, works out to 10.89% and 11.13% for 10 years and 15 years, respectively, higher than 8.5-9% on bank fixed deposit and other stable fixed income instruments. CARE and IRRPL have assigned AA+ rating for the bond issue, which is a notch below the highest AAA rating. The rating signifies a low credit risk. HUDCO is a wholly owned government company conferred with a Mini Ratna status. Increased focus of the government on the infrastructure space, going forward, may further augment government support and focus in development of HUDCO. Also, the secured nature of the bond makes them less risky making it a good fixed income investment option.

Issue details: The Central Government in exercise of the powers conferred by Section 10(15)(iv)(h) of the Income Tax Act, 1961 authorises HUDCO to issue during FY12-13, tax free, secured, redeemable, non-convertible bonds up to Rs 5000 crore. In the current year, through tranche I company has collected Rs 2215 crore.

HUDCO tranche II tax free bond comes with a coupon rate of 7.53% and 7.69% for 10 years and 15 years, respectively, for a retail investor. It is the highest coupon rate among ongoing tax free bond issues, as it is rated AA+ a notch below AAA ratings of assigned to other bonds. However, there is no significant credit risk difference in the two ratings.

The coupon on the bond issued under the tax exempt clause is related to the prevailing government securities rates. The ceiling in the coupon rate for a AA rated issuer is fixed at 80 basis points (bps) below the reference G-sec rate for the retail investor and 100 bps lower for others. It may be noted that the differential rate for retail investors shall be applicable only to original allottees. In the event of sale/transfer by the original allottee of the bond, the subsequent allottee will get the rates of other investor's category. Hence, in order to get higher coupon it is advisable for a retail investor to subscribe to this new issue and hold till maturity," says ICICIdirect.com research report.

Disclaimer: The views and investment tips expressed by investment experts/broking houses/rating agencies on moneycontrol.com are their own, and not that of the website or its management. Moneycontrol.com advises users to check with certified experts before taking any investment decisions.

Top Small Cap Stocks To Watch Right Now

To read the full report click here

Friday, August 30, 2013

Reflections from 20 Years of Investing (2001-2008) Pt 2


"Creativity is just connecting things. When you ask creative people how they did something, they feel a little guilty because they didn't really do it, they just saw something. It seemed obvious to them after a while" – Steve Jobs


I was brimming with confidence entering 2004; I had just recorded my best year ever in terms of gains versus the S&P. All the market indices had recorded a resounding rally since the early fall of 2002; the rally was fueled by the Federal Reserve's monetary easing policy and a new found optimism about future of corporate profits. It seemed that the tragedy of September 11 was now a distant memory and its effects on the psyche of the US consumer had all but disappeared.


Following precipitous market rallies, value investors must devote increasing research time to uncover bargains. Such was the case in 2004, many of the obvious values had disappeared and simple asset plays, as well as beaten down cyclical stocks were quickly vanishing from the screens of value investors.


During such times, investors either have to become more imaginative in regard to uncovering value propositions, or reduce the number of companies that they hold in their portfolios. At that point in my investing career, I still lacked the confidence to hold just a few large positions; thus I decided to become more creative in my investments. I starting searching for theme investments which I thought would prosper during the cyclical recovery.


The Investing Climate in 2003-2007


Oil, natural gas and other commodities were entering a bull market, driving up the value of the companies who owned or leased the land which held the resources. Oil service and equipment stocks as well as the mining equipment companies would benefit mightily as the demand for their products and services rose dramatically.


Likewise with the housing market, not only were home builders and banks benefiting from the housing boom, so too wer! e the building material suppliers and virtually any business which was related to the worldwide surge in housing market.


I started to focus upon finding companies that would benefit from the aforementioned investment themes, but only investing in companies which still held reasonable valuation metrics. The idea was to locate companies that remained undiscovered by Wall Street which were likely to increase their forward earnings. Furthermore, such companies would frequently become buyout candidates, as larger companies looked to increase their earnings by acquiring businesses that were not already "sky high" in price.


When I would check the ownership of many of the companies that I found to be worthy of research, I frequently ran across the name of Jeffrey Gendell who titled his hedge fund Tontine Asset Management.


The Rise and Fall of Tontine Asset Management and ENGlobal (ENG)


Gendell rarely conducted interviews, almost never publicizing his stock selections or his theories in regard to investing. The average investor had never heard of him or his hedge fund; however anyone who tracked money managers closely, was well aware the outstanding returns which were flowing into the pockets of the clients at Tontine. In 2003 and 2004, Gendell recorded near miraculous gains, approximately doubling the value of his portfolios, in back to back years.


Gendell first caught the eye of Wall Street when he became extremely bullish on US steel companies in the early 2000s. Similar to today, US steel companies were on the outs with investors and Tontine boldly stepped in, heavily overweighting the sector. Shortly after Gendell entered the sector, steel companies began a protracted bull market; it seems that Wall Street had a brand new emerging superstar that was capable of spotting cyclical bottoms as well as possessing sufficient courageous to act upon his convictions.


The prodigious gains of Gendell caught my eye as well, and I began ! to track ! the companies in which he held significant ownership. One of the companies that I ran across was tiny ENGlobal (ENG), a Houston-based provider of engineering services to the energy sector. The stock fit my investing theme perfectly and it did not hurt my confidence to know that Gendell felt the same way. Further, the stock appeared to be reasonably valued in terms of the business the company was writing and I believed that its earnings were about ready to spike upward. As you can see, I was not exactly demanding a large margin of safety in my theme investments at that point in time.


I purchased ENG in the spring of 2005 for $2.20 a share; by the mid to late summer of the same year, the stock had climbed to around 9.00 a share. I now had to make a decision on whether to sell the stock and take my gains or continue to hold the stock. As it turns out my decision was made considerably easier when I turned on Mad Money that night and much to my amazement, Jim Cramer was touting this tiny microcap stock. My decision was now etched in stone; I sold ENG at the open of the market the following day, for exactly 9.00 per share.


It had been my experience that Cramer's late entry into a momentum stocks generally resulted in a market top for the equity. Such was the case with ENG, after the price ascended slightly higher, the stock quickly dropped below 7 dollars a share. In fairness to Cramer, the stock did go much higher several years later but that was a merely temporary spike, the case of a low quality company hitting a temporary sweet spot. A few years later the stock steadily dropped and never recovered; today it trades under a dollar a share.


Now back to the saga of Jeffrey Gendell and Tontine Asset Management. It seemed that Mr. Gendell was not adhering to Ben Graham's prime directive which suggested that investors should minimize their risk by demanding a sufficient margin of safety on their investment selections. Not only was the hedge fund highly leveraged but al! most his ! entire portfolio was concentrated in debt-laden cyclical companies which were currently benefiting from rising real estate and commodity prices. Apparently, Gendell simply did not believe that the bull market which was triggered by the real estate bubble and the boom cycle in commodities was going to end any time soon.


To make a long story short, in early 2009 Tontine was forced into liquidating its positions and shutting down the fund. I noticed one of the stocks that Gendell was forced to sell was ENG—I wonder if Cramer was still holding the stock? The experience served as a lesson for all investors (me included) who might decide to coat-tail a respected investor without regard to performing their own due diligence on the guru's stock purchases. The Gendell saga also exposed the extreme danger of employing excessive margin in the hopes of "juicing" one's investment returns.


The Essential Points Successful Theme Investing


I will close out today's discussion by integrating value theory into successful theme investing. Theme investing can help investors identify cyclical companies which may benefit from a temporary period of enhanced earnings, as a result of favorable macro or micro economic conditions. Further, a well constructed economic thesis might identify a stock with a powerful catalyst in the form of an acceleration of future earnings. That said, merely identifying companies that are likely to temporarily prosper in terms of earnings is not enough; the stocks must also contain favorable valuation metrics or the investor is merely engaging in speculation. In other words, the stock must also be cheap or it should be avoided without regard to a impending earnings explosion.


One of the common banes that plague the average investor is his/her affinity for selecting stocks which are trading at or near their multiyear highs. If one wishes to become a successful value investor, that tendency needs to be eliminated promptly. Not! hing is m! ore damaging to long term capital appreciation than being chronically late to the party. There is no shame in recognizing a catalyst after the stock has already moved; that is merely a fact of life in investing. The shame lies in committing one's hard earned capital into a stock which has already moved precipitously and is now becoming over priced.


John Maynard Keyes once opined: "Successful Investing is anticipating the anticipation of others." That notion applies in spades when it comes to theme investing. Typically, a stock moves upwards long before its improvement in earnings comes to fruition. Warren Buffett colorfully observed: "If you wait for the robins, spring will be over." Should an investor wait for an earnings confirmation to validate his/her theory, then the time to invest will have already passed. I will end today's discussion by profiling two successful investments I made in high quality cyclical companies during the period of the mid-2000s. The companies are: Maverick Tube (formerly MVK) and Astec (ASTE).


Maverick Tube: A Strong Demand in OCTG Leads to a Buyout


Entering 2005 I was scouring the oil service and equipment sector for undervalued companies. Being somewhat late to the party, it was difficult to uncover many stocks in the sector that offered much value. Most of the companies had experienced earnings explosions in 2004 and were now trading at multiyear highs, in addition to sporting exorbitant trailing PE multiples.


The 2004 hurricane had done extensive damage to offshore rigs in the Gulf of Mexico. The following year, the US would experience one of its worst hurricane seasons on record which would result in record natural gas prices in late 2005 and early 2006.


At that point in time, land drillers did not possess the technology to extract the massive reserves of natural gas which existed deep in shale deposits throughout the United States. Natural gas typically traded between six to ten times t! he price ! of crude oil. Generally speaking, high oil prices begat high natural gas prices. Additionally, the US natural gas market was isolated from world markets since barriers to its worldwide transportation existed. Therefore, severe disruptions in off shore reserves significantly disrupted the supply of natural gas in the US, which in turn increased demand for US land drillers.


The aforementioned demand and subsequent increase in natural gas prices, lead to an unprecedented increase in the need for Oil Country Tubular Goods (OCTG). The record demand for steel pipes which were used in the drilling of natural gas wells was resulting in record profits at Maverick Tube (formerly MVK). Maverick Tube was one largest suppliers of tubular steel products for the energy sector, in the United States and Canada.


In 2004, Maverick Tube had recorded profits in excess of $4.50 per share. Although, the stock had risen significantly in the last several years, its price still appeared to be reasonable at around 40 dollars a share, in the mid to latter months of 2005. Furthermore, Maverick was not a "one-trick-pony". They were also doing well in their industrial segment which supplied steel conduit to the commercial building market. Additionally, company had an excellent history of profitability.


In mid 2005, the Baker-Hughes rig count which echoed the demand for the company's energy products was continuing to increase. As natural gas prices continued to ascend in 2005, it appeared that Maverick's earnings would continue to increase well into 2006.


Maverick appeared to be one of the few bargains still available in the oils service and equipment sector in 2005. Shareholders were rewarded a year later when the company was acquired by Tenaris (TS) at a price of 65 dollars a share in June of 2006.


Following the acquisition of Maverick, I quickly rolled my profits into Long Star Technologies (formerly LSS) which at the time was Maverick's chief rival. Lo! ne Star w! as subsequently acquired by US Steel (X) approximately one year later. In retrospect, I believe I was extremely fortunate to have the company taken out at that time, since I doubt if I would have sold out of my position in Lone Star any time soon.


Natural gas prices would experience a final large spike in early 2008 but they would soon drop precipitously. In a few months, the credit crisis of 2008 would dramatically suppress the demand for OCTG and other energy related products. I believe that Long Star's price per share would have quickly eroded to a level well below my original purchase price.


One of the major lessons I have learned in the course of my investing career is that cyclical stocks must be sold when they still appear to be cheap in terms of price to earnings. Alternatively, the best time to purchase them is when they are historically cheap in terms of their price to book ratio. At that point the companies are generally losing money or recording little in the way of net income. The counter-intuitive nature of such equities will likely continue to confound investors for the foreseeable future.


Astec Industries (ASTE): A Play on the Highway Bill of 2005


Deep Throat allegedly implored Bernstein and Woodward to "follow the money" in order to solve the mystery of the break in which occurred at the Watergate hotel; the success of the young reporters eventually led to the resignation of Richard Nixon. In mid 2005, I was employing exactly the same strategy in my attempt to uncover undervalued theme stocks which would benefit from the flood of money that would soon be released by the federal government in an attempt to rebuild our infrastructure.


Initially I became excited in August of 2005 when following a series of delays, the Safe, Accountable, Flexible, Efficient Transportation Equity Act: A Legacy for Users, (commonly referred to as the Highway Bill) was put into law. I would spend an inordinate amount of time at! tempting ! to identify companies which would temporarily benefit financially as a result of its passage. Following an extensive period of internet research, I was unable to uncover any undervalued stocks related to US infrastructure that I felt would benefit from the impending release of federal funds in accordance with the act. In essence, I had stuck out; I decided to give up and spend my time in a more productive manner.


In the summer of 2006, I was combing through the 52-week lows when a very interesting stock presented itself. The company was Astec Industries (ASTE), and they made the majority of their profits from various types of asphalt equipment which was principally used in US road construction. I immediately delved full throttle into the company's filings and started listening to their conference calls.


Astec was one of the first companies that convinced me that about the expediency of listening to conference calls. The former CEO of ASTE was J. Don Brock, and he was a veritable fountain of information relating to the road construction business. Listening to his conference calls was tantamount to enrolling in a road construction school. He would inform the listeners about the difference in prices between concrete and asphalt, the amount of regrind that was permitted in a particular state, the cost to repave a road, as well as many of the microeconomics that supported the various machines that the company manufactured and sold.


It took me very little time to decide that I should not "look this gift horse in the mouth"; rather I decided to start buying ASTE hand over fist. I reread the annuals and quarterly reports and researched the effect of the prior Highway bill (which was passed in 1998) on the company's earnings and stock price; rarely have I ever become so excited in regard to the prospects of a stock.


As a matter of fact, I was so confident that I implored all of my friends to get involved in the stock. I even recommended it to our son ! and his w! ife, something which I had never done before. I wrote the stock up on message boards, complete with charts and an extensive rational for purchasing the stock which included an assessment of when one would need to sell their holdings.


I planned to sell the stock in just over a year (to avoid short term gains) at what I believed would be about the midpoint of their earnings explosion. I believed that the company would continue to prosper for about another year following my sale but I was extremely concerned about savvy investors selling their positions long before the company's earnings began to turn downward. I had learned a considerable amount about buying and selling cyclical stocks and in the case of ASTE, I had noticed that the stock had began to drop long before their earnings began to recede during the preceding Highway Bill boom and bust cycle.


As it turned out my analysis was spot on; I had never previously—and probably never will again— handicap a stock so perfectly. I bought the stock around its 52-week low at an average cost of under 25 dollars a share and sold it slightly over a year later in the Summer of 2007, in the mid to high fifty dollar range, virtually at its all-time high.


We were visiting our kids in Virginia at the time of the second quarter conference call in August of 2007. Astec's earnings were phenomenal and the prospects appeared good for the rest of the year, but I had already made my decision in advance. I borrowed my son's computer and sold every share of ASTE that very morning.


After selling my shares I made it a point to advise my son and his wife to sell immediately, reiterating every detail which I had made when I advised them to buy the stock. I specifically recall admonishing them that "cyclical stocks must be sold when their earnings still improving" and ASTE had just announced record earnings.


Following a precipitous decline in Astec stock a few months later, I called my son and daughte! r-in-law ! to reiterate how wise they were to sell the stock and take their profits. Much to my dismay, I found out that they had not divested a single share of Astec stock; I might as well have been lecturing to a wall. Such is the power of a high momentum stock on a novice investor's psyche; apparently my reasoning and prescribed plan of attack, was not sufficient to overcome the lure of continuing to hold a rapidly rising stock.


Reflections from Twenty Years of Investing will return with the final edition for the years from 2001-2008 (it seems that describing this period is taking longer than I had anticipated). The edition will cover Imperial Sugar, a number of Chinese stocks and a profound investing error that severely damaged my long term rate of return.


Thursday, August 29, 2013

Array Begins Phase III Study on MEK162 - Analyst Blog

10 Best Medical Stocks To Watch For 2014

Array BioPharma Inc. (ARRY) recently initiated a phase III study (MILO: n=300) on MEK162 in patients suffering from low-grade serous ovarian cancer (LGSOC). Array consequently received a $5 million milestone payment from partner, Novartis (NVS), following the initiation of the study.

The multinational, randomized study will evaluate MEK162 in 300 patients suffering from recurrent or persistent LGSOC after a minimum of one platinum-based chemotherapy regimen and not more than three lines of prior chemotherapy regimens. The study will evaluate the effects of MEK162 in these patients in comparison to the physician's choice of standard chemotherapy treatments. The main objective of the study will be to evaluate progression-free survival and overall survival.

We note that in Apr 2010, Array and Novartis entered into a license agreement for MEK162 besides other specified MEK inhibitors. As per the terms of the deal, Novartis has the worldwide rights to co-develop and commercialize MEK162.

Array has already received $60 million (including the recent $5 million milestone payment) as an upfront fee and milestone payments under the deal. Array is eligible to receive further payments on achieving all the clinical, regulatory and commercial milestones stated in the agreement.

Array further stated in its press release that Novartis is gearing up to initiate phase III studies on MEK162 in both NRAS- and BRAF-mutant melanoma later this year.

Array also has ARRY-520 (refractory multiple myeloma) and ARRY-380 (breast cancer) in its oncology portfolio apart from MEK162. We are encouraged by the company's progress with its oncology candidates. However, the oncology market currently has big players such as Roche (RHHBY).

Currently, Array BioPharma carries a Zacks Rank #3 (Hold). However, biopharma stocks such as Jazz Pharmaceuticals (JAZZ! ) presently look better positioned with a Zacks Rank #1 (Strong Buy).

Wednesday, August 28, 2013

RadioShack Slips to Underperform - Analyst Blog

We downgrade our recommendation on RadioShack Corp. (RSH) to Underperform ahead of its second-quarter 2013 financial results. We do not find any immediate growth catalyst and consequently do not expect the company to achieve profitability anytime soon.

Why the Downgrade?

The nightmare of RadioShack persists as the company continues to perform disappointingly. This somber condition is mainly due to weakness in the company's postpaid Wireless business. The company's core Consumer Electronics retail business is on a secular downtrend.

Consumers now prefer purchasing online to visiting retail stores. Declining foot traffic has severely affected RadioShack's business. Most of the consumers prefer tablets and smartphones, which are less profitable for the retail industry. Moreover, the retail industry has become more competitive. Management suspended its dividend payment in order to reduce the company's debt burden.

A major near-term concern for RadioShack is the significant decline in its gross margin. In the first quarter of 2013, gross margin was 39.7% compared with 40.5% in the prior-year quarter. This was mainly due to an unfavorable sales mix of lower-margin smartphones and other mobile devices.

In the first quarter of 2013, the comparable store sales for the company-operated stores and kiosks (stores and kiosks that have been operational for at least a year) were down 5.7% year over year. This is a key retail performance indicator measuring growth from the existing sale locations.

RadioShack is facing intense competition from larger rivals like Best Buy Co. Inc. (BBY) and Wal-Mart Stores Inc. (WMT). Best Buy plans to open 600 to 800 mobile stores within 5 years, which in turn, will negatively impact RadioShack's market share. These stores will mainly be located in shopping malls, where RadioShack traditionally operates.

Additionally, Wal-Mart intends to offer low-priced pre-paid wireles! s service. RadioShack is also facing stiff competition from online retailer, Amazon.com Inc. (AMZN).

Sunday, August 25, 2013

5 Stocks Poised for Breakouts

 DELAFIELD, Wis. (Stockpickr) -- Trading stocks that trigger major breakouts can lead to massive profits. Once a stock trends to a new high, or takes out a prior overhead resistance point, then it's free to find new buyers and momentum players that can ultimately push the stock significantly higher.

One example of a successful breakout trade I flagged recently was basic materials player Cliffs Natural Resources (CLF), which I featured in Aug. 5's "5 Stocks Ready to Break Out" at around $20.50 a share. I mentioned in that piece that shares of CLF recently formed a double bottom chart pattern at $15.50 to $15.41 a share. After bottoming, this stock entered a strong uptrend with shares moving higher $15.41 to over $20 a share. That move was quickly pushing shares of CLF within range of triggering a near-term breakout trade above some key overhead resistance levels at $20.30 to $21.96 a share.

Guess what happened? Shares of CLF didn't wait long to trigger that breakout after the stock briefly pulled back to around $20 a share. On Aug. 8, shares of CLF ripped sharply to the upside with heavy volume as the stock started to flirt with those key breakout levels. Then on August 9 shares of CLF exploded to the upside with big volume as the stock trended above $24.50 a share. This stock touched a recent high of $25.95 a share, which represents a powerful gain of just over 25% in a very short timeframe.

Breakout candidates are something that I tweet about on a daily basis. I frequently tweet out high-probability setups, breakout plays and stocks that are acting technically bullish. These are the stocks that often go on to make monster moves to the upside. What's great about breakout trading is that you focus on trend, price and volume. You don't have to concern yourself with anything else. The charts do all the talking.

Trading breakouts is not a new game on Wall Street. This strategy has been mastered by legendary traders such as William O'Neal, Stan Weinstein and Nicolas Darvas. These pros know that once a stock starts to break out above past resistance levels, and hold above those breakout prices, then it can easily trend significantly higher.

With that in mind, here's a look at five stocks that are setting up to break out and trade higher from current levels.

Apple

One name that's quickly pushing within range of triggering a big breakout trade is Apple (AAPL), which designs, manufactures and markets personal computers, mobile communication devices, media devices and portable digital music and video players and sells a variety of related software, services, peripherals and networking solutions. This stock has been on fire during the last three months, with shares up sharply by 15.5%.

If you take a look at the chart for Apple, you'll notice that this stock has been uptrending strong for the last month and change, with shares skyrocketing higher from its low of $386.32 to its recent high of $501.62 a share. During that uptrend, shares of AAPL have been consistently making higher lows and higher highs, which is bullish technical price action. That move has now pushed shares of AAPL within range of triggering a big breakout trade.

Traders should now look for long-biased trades in AAPL if it manages to break out above some key overhead resistance levels at $504.25 to $505.30 a share with high volume. Look for a sustained move or close above those levels with volume that hits near or above its three-month average volume of 12.53 million shares. If that breakout hits soon, then AAPL will set up to re-test or possibly take out its next major overhead resistance levels at $545 to $583 a share.

Traders can look to buy AAPL off any weakness to anticipate that breakout and simply use a stop that sits right below some near-term support at $490 a share, or just below $480 a share. One could also buy AAPL off strength once it takes out those breakout levels with volume and then simply use a stop that sits a comfortable percentage from your entry point.

Amarin

Another stock that looks poised to trigger a major breakout trade is Amarin (AMRN), a biopharmaceutical company that commercializes and develops therapeutics to improve cardiovascular health. This stock has been under pressure by the bears so far in 2013, with shares off sharply by 26%.

If you take a look at the chart for Amarin, you'll notice that this stock has been downtrending badly for the last six months, with shares dropping from over $9 to its recent low of $5.12 a share. During that downtrend, shares of AMRN have been consistently making lower highs and lower lows, which is bearish technical price action. That said, shares of AMRN have now formed a double bottom chart pattern $5.12 to $5.13 a share and are starting to trend back above its 50-day moving average of $5.82 a share. That move is quickly pushing shares of AMRN within range of triggering a major breakout trade.

Traders should now look for long-biased trades in AMRN if it manages to break out above some near-term overhead resistance at $6.20 a share with high volume. Look for a sustained move or close above that level with volume that hits near or above its three-month average action 3.77 million shares. If that breakout hits soon, then AMRN will set up to re-test or possibly take out its next major overhead resistance levels at $7.17 to $7.30 a share. Any high-volume move above those levels will then put $8 to $8.50 within range for shares of AMRN.

Traders can look to buy AMRN off any weakness to anticipate that breakout and simply use a stop that sits right below some key near-term support levels at $5.13 to $5.12 a share. One could also buy AMRN off strength once it takes out those breakout levels with volume and then simply use a stop that sits a comfortable percentage from your entry point.

This stock is another favorite target of the bears, since the current short interest as a percentage of the float for AMRN is very high at 17.4%. This stock could easily experience a powerful short-squeeze if it triggers that breakout soon, so make sure to keep this name on your radar.

Wynn Resorts

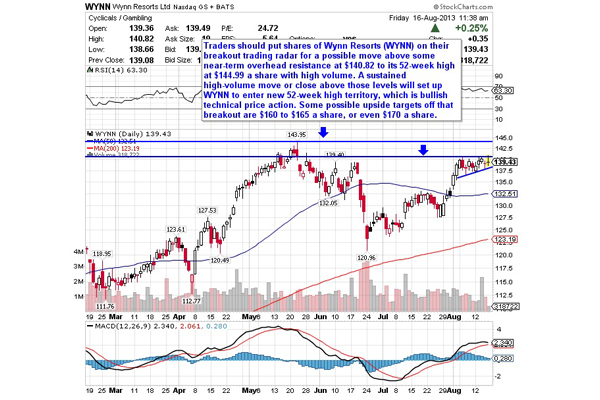
One gambling player that's starting to move within range of triggering a near-term breakout trade is Wynn Resorts (WYNN), a developer, owner and operator of destination casino resorts. This stock has been trending hot so far in 2013, with shares up 24%.

If you look at the chart for Wynn Resorts, you'll notice that this stock has been uptrending strong for the last two months, with shares moving higher from its low of $120.96 to its intraday high of $140.82 a share. During that uptrend, shares of WYNN have been consistently making higher lows and higher highs, which is bullish technical price action. Shares of WYNN have been consolidating for the last few weeks, moving between just below $137 to just above $140 a share. A high-volume move above the upper-end of its recent sideways trading chart pattern could trigger a big breakout trade for shares of WYNN.

Traders should now look for long-biased trades in WYNN if it manages to break out above some near-term overhead resistance at $140.82 to its 52-week high at $144.99 a share with high volume. Look for a sustained move or close above those levels with volume that hits near or above its three-month average action of 1.30 million shares. If that breakout triggers soon, then WYNN will set up to enter new 52-week-high territory, which is bullish technical price action. Some possible upside targets off that breakout are $160 to $165 a share, or even $170 a share.

Traders can look to buy WYNN off any weakness to anticipate that breakout and simply use a stop that sits right below its 50-day moving average of $132.51 a share. One can also buy WYNN off strength once it takes out those breakout levels with volume and then simply use a stop that sits a comfortable percentage from your entry point.

Organovo

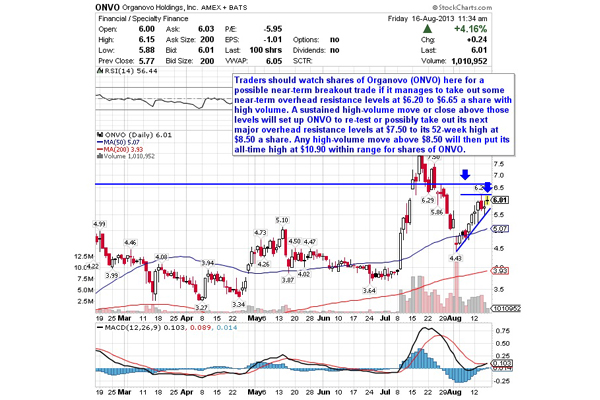
Another stock that's starting to move within range of triggering a near-term breakout trade is Organovo (ONVO), a three-dimensional biology company focused on delivering breakthrough bioprinting technology and creating tissue on demand for research and medical applications. This stock has been on fire so far in 2013, with shares up sharply by 133%.

If you look at the chart for Organovo, you'll notice that this stock recently pulled back sharply from its high of $8.50 to its recent low of $4.43 a share. During that move, shares of ONVO were consistently making lower highs and lower lows, which is bearish technical price action. That said, the downside volatility stopped for ONVO once it hit $4.43 a share, and the stock has now reversed its downtrend and entered an uptrend. That move is quickly pushing ONVO within range of triggering a near-term breakout trade.

Traders should now look for long-biased trades in ONVO if it manages to break out above some near-term overhead resistance levels at $6.20 to $6.65 a share with high volume. Look for a sustained move or close above those levels with volume that hits near or above its three-month average action of 2 million shares. If that breakout triggers soon, then ONVO will set up to re-test or possibly take out its next major overhead resistance levels at $7.50 to its 52-week high at $8.50 a share. Any high-volume move above $8.50 will then put its all-time high at $10.90 within range for shares of ONVO.

Traders can look to buy ONVO off any weakness to anticipate that breakout and simply use a stop that sits right below its 50-day at $5.07 a share, or just below $5 a share. One can also buy ONVO off strength once it takes out that breakout levels with volume and then simply use a stop that sits a comfortable percentage from your entry point.

Eagle Bulk Shipping

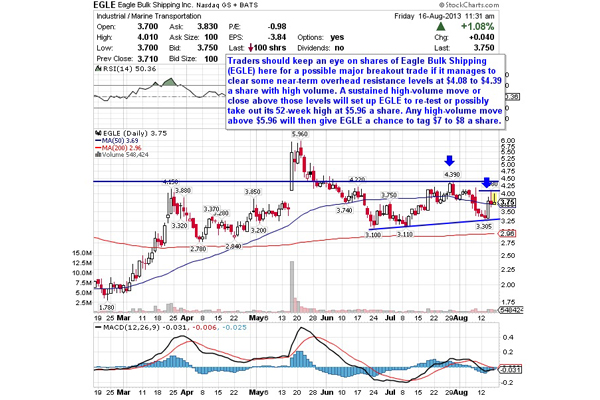
My final breakout trading prospect is Eagle Bulk Shipping (EGLE), whose business activities include ocean transportation of a range of major and minor bulk cargoes, including iron ore, coal, grain, cement and fertilizer, along worldwide shipping routes. This stock has been ramping huge to the upside so far in 2013, with shares up by 163%.

If you look at the chart for Eagle Bulk Shipping, you'll notice that this stock has been trending sideways inside of a consolidation chart pattern for over the last two months and change, with shares moving between $3.10 on the downside and $4.39 on the upside. Shares of EGLE have now started to bounce strongly right off its 50-day moving average of $3.69 a share, and that move is quickly pushing EGLE within range of triggering a big breakout trade.

Traders should now look for long-biased trades in EGLE if it manages to break out above some near-term overhead resistance levels at $4.08 to $4.39 a share with high volume. Look for a sustained move or close above those levels with volume that hits near or above its three-month average action of 760,091 shares. If that breakout triggers soon, then EGLE will set up to re-test or possibly take out its 52-week high at $5.96 a share. Any high-volume move above $5.96 will then give EGLE a chance to tag $7 to $8 a share.

Traders can look to buy EGLE off any weakness to anticipate that breakout and simply use a stop that sits right below some key near-term support at $3.30 a share, or below $3.10 a share. One could also buy EGLE off strength once it clears those breakout levels with volume and then simply use a stop that sits a conformable percentage from your entry point.

This stock is very popular among the short-sellers, since the current short interest as a percentage of the float for EGLE is extremely high at 17.3%. If that breakout hits soon, then EGLE could easily explode sharply higher as the bears rush to cover some of their short bets.

To see more breakout candidates, check out the Breakout Stocks of the Week portfolio on Stockpickr.

-- Written by Roberto Pedone in Delafield, Wis.

Saturday, August 24, 2013

Top Gold Companies To Buy Right Now

Just a few weeks after Paulson & Co. sold off more than half of its holdings in the SPDR Gold Trust ETF (GLD) in the second quarter, investors are moving back into the precious metal.

GLD is trading up about 0.5% on Friday and should end the week up about 2% vs. a 2% decline for the S&P 500. At the same time, volatility in the markets is down about 1% today, but should end the week up 6%.

As gold futures rose about 2% on Thursday, JPMorgan analysts said in a report, “This may be delivering an exclamation mark to define the end of the 10-month, 25% fall in gold and 50% fall in gold equities.”

In general, the Federal Reserve’s quantitative easing program has a negative impact on the dollar, is viewed as inflationary and hence improves the outlook for gold, long seen as an inflation hedge.

Top Gold Companies To Buy Right Now: CME Group Inc.(CME)

CME Group Inc. operates the CME, CBOT, NYMEX, and COMEX regulatory exchanges worldwide. The company provides a range of products available across various asset classes, including futures and options on interest rates, equity indexes, energy, agricultural commodities, metals, foreign exchange, weather, and real estate. It offers various products that provide a means of hedging, speculation, and asset allocation relating to the risks associated with interest rate sensitive instruments, equity ownership, changes in the value of foreign currency, credit risk, and changes in the prices of commodities. CME Group owns and operates clearing house, CME Clearing, which provides clearing and settlement services for exchange-traded contracts and counter derivatives transactions; and also engages in real estate operations. Its primary trade execution facilities consist of its CME Globex electronic trading platform and open outcry trading floors, as well as privately negotiated transact ions that are cleared and settled through its clearing house. In addition, the company offers market data services comprising live quotes, delayed quotes, market reports, and historical data services, as well as involves in index services business. CME Group?s customer base includes professional traders, financial institutions, institutional and individual investors, corporations, manufacturers, producers, and governments. It has strategic partnerships with BM&FBOVESPA S.A., Bursa Malaysia Derivatives, Singapore Exchange Limited, Green Exchange, Dubai Mercantile Exchange, Johannesburg Stock Exchange, and Bolsa Mexicana de Valores, S.A.B. de C.V., as well as joint venture agreement with Dow Jones & Company. The company was formerly known as Chicago Mercantile Exchange Holdings Inc. and changed its name to CME Group Inc. in July 2007. CME Group was founded in 1898 and is headquartered in Chicago, Illinois.

Top Gold Companies To Buy Right Now: Northgate Minerals Corporation(NXG)

Northgate Minerals Corporation, together with its subsidiaries, engages in exploring, developing, processing, and mining gold and copper deposits in Canada and Australia. Its principal producing assets include 100% interests in the Fosterville and Stawell Gold mines in Victoria, Australia; and the Kemess South mine located in north-central British Columbia, Canada. The company was formerly known as Northgate Exploration Limited and changed its name to Northgate Minerals Corporation in May 2004. Northgate Minerals Corporation was founded in 1919 and is headquartered in Toronto, Canada.

Advisors' Opinion:
  • [By Christopher Barker]

    I've been reminding Fools to consider positioning for Northgate Minerals' golden explosion for months, and patient gold investors continue to await the day when Northgate's powerful prospects are more fully reflected in the shares. Construction of the critical Young-Davidson mine continues right on schedule, and first production now stands about two quarters away. That means Northgate is reasonably likely to achieve its 2012 production target of 300,000 ounces, followed by 350,000 ounces in 2013. Meanwhile, Northgate recently drilled "one of the best holes ever intersected on the property" -- featuring 4.31 grams of gold per ton over a very wide 79.6-meter segment -- from a new discovery zone outside of the existing 2.8 million-ounce reserve.

    If Young-Davidson were Northgate's sole asset, these shares would still be undervalued here at about $2.60 per share. With a preliminary assessment looming for the reworked Kemess Underground project, a new drill program at the Awakening Gold project in Nevada, and two operating gold mines in Australia, Northgate figures among the clearest bargains in the gold patch.

Hot Oil Stocks To Watch For 2014: Agnico-Eagle Mines Limited(AEM)

Agnico-Eagle Mines Limited, through its subsidiaries, engages in the exploration, development, and production of mineral properties in Canada, Finland, and Mexico. The company primarily explores for gold, as well as silver, copper, zinc, and lead. Its flagship property includes the LaRonde mine located in the southern portion of the Abitibi volcanic belt, Canada. The company was founded in 1953 and is based in Toronto, Canada.

Advisors' Opinion:
  • [By Vatalyst]

    With headquarters in Canada, Agnico-Eagle is a gold producer that has been around for a while with operations in Canada, Finland and Mexico and the United States that has paid a cash dividend for 29 consecutive years. AEM gained 25% over the year and reported 83.5% growth in quarterly earnings. It has a market capitalization of $11.4 billion and a trailing P/E ratio of 34x with expectations of earning $0.55 per share. AEM, like other operators like it, are likely a better bet than ETF trust options like SPDR Gold Shares (GLD).

Top Gold Companies To Buy Right Now: Goldcorp Incorporated(GG)

Goldcorp Inc. engages in the acquisition, exploration, development, and operation of precious metal properties in Canada, the United States, Mexico, and Central and South America. It produces and sells gold, silver, copper, lead, and zinc. The company was founded in 1954 and is headquartered in Vancouver, Canada.

Advisors' Opinion:
  • [By Smith]

    Although its name does little to denote this, Goldcorp is a well-positioned silver play for 2011, according to the analysts we surveyed.

    “The name is one that people tend to think of it as gold, but it's in the top 20 of silver producers globally with about 13 million ounces a year ,” says Peter Sorrentino of Huntington Funds.

    Morningstar analyst Min Tang-Varner recently raised her fair value estimate for Goldcorp by $12 a share to $48 after the company reported a 28 per cent rise in revenue for the third quarter ended Sept. 30 compared with the year before.

    This, despite 4 per cent decline gold production, as revenue received a boost from $1,239/oz realized gold prices and $19.15/oz silver prices.

    Tang-Varner tells investors that the reduction of Goldcorp's cash cost by $100/oz from the prior quarter to $260/oz due to higher silver, copper and zinc production and the run-up in their prices, was “rather extraordinary.”

    Sorrentino says Goldcorp is a stock that investors would be “wise to consider” if they were looking for a name that would be discovered suddenly as a major silver play, without feeling that they were overpaying for it.

    Goldcorp also prices everything that it does in Canadian dollars, which should reduce currency risks for investors in Canada.

  • [By Christopher Barker]

    Every ship needs an anchor, and for gold investors looking to navigate the admittedly rough seas of the gold mining industry, I can think of no greater anchor than Goldcorp. With the important caveat that some of the company's substantial challenges faced during 2012 could present further selling pressure in early 2013 as forward production guidance takes a bit of a haircut, I agree with Credit Suisse analyst Anita Soni that any such weakness may present a meaningful buying opportunity. I won't go into great detail here, since investors can access my premium research report on Goldcorp for further discussion of the substantial long-term investment opportunity in the shares of this quality producer.

Friday, August 23, 2013

Hot Undervalued Companies To Invest In Right Now

The stock market can be a wonderful thing, helping you grow your wealth and enjoy a comfortable retirement. But it can also fry your precious nest egg if you're not careful. My colleague Morgan Housel has noted that the financial industry "is dominated by cranks, charlatans, and salesmen" -- but very often, we're the ones who most endanger our portfolios and our financial futures with our reckless investment ideas. Permit me to review just a few.

"Wow, this cheap stock is only $0.13 per share! I can buy 10,000 shares for just $1,300!"
Penny stocks -- those trading for less than about $5 per share -- are usually very bad investment ideas, as they can be easily manipulated and are often tied to shaky, unproven companies. Sure, they entice us with their seemingly cheap prices, and the thought of owning 10,000 shares of something is somehow more exciting than owning far fewer shares. But a low price isn't necessarily a cheap price. A $200 stock can be undervalued and more likely to rise than fall while a $0.13 stock can be worth much less than that and be more likely to fall than rise.

Hot Undervalued Companies To Invest In Right Now: Sirtex Medical Ltd(SRX.AX)

Sirtex Medical Limited, a biotechnology and medical device company, engages in the research, development, manufacture, and distribution of liver cancer treatments utilizing small particle technology. The company offers SIR-Spheres microspheres with Yttrium 90 radioactive microspheres for the treatment of liver tumors. It also focuses on the research and development of Radioprotector, Nanoparticle, and Microsphere technologies. Sirtex Medical Limited markets its products in the Asia-Pacific, Europe, and the United States. The company, formerly known as Paragon Medical Limited, was founded in 1997 and is based in North Sydney, Australia.

Hot Undervalued Companies To Invest In Right Now: Hillenbrand Inc(HI)

Hillenbrand, Inc. designs, manufactures, distributes, and sells funeral service products to licensed funeral directors operating licensed funeral homes. The company?s products include burial caskets, cremation caskets, containers, vaults, urns, and selection room display fixturing for funeral homes, as well as other personalization and memorialization products and services, including Web-based applications, and the creation and hosting of Websites for licensed funeral homes. It markets its products under the Batesville and Options brand name through direct sales force in the United States, Puerto Rico, Canada, Mexico, the United Kingdom, and Australia. The company also designs, produces, markets, sells, and services bulk solids material handling equipment and systems for various industrial markets, including plastics, food, chemicals, pharmaceuticals, power generation, coal mining, pulp and paper, frac sand, industrial minerals, agribusiness, recycling, wood and forest pr oducts, and biomass energy generation. It offers feeders and pneumatic conveying equipment under the K-Tron brand name; and size reduction equipment, such as hammer mills, double-roll crushers, wood and bark hogs, chip sizers, screening equipment, pneumatic and mechanical conveying systems, storage/reclamation systems, and specialty crushers and other equipment under the Pennsylvania Crusher, Gundlach, and Jeffrey Rader brand names. In addition, the company manufactures dry material separation machines that sort dry, granular products based on the particle?s size serving various industries, including frac sand, potash, urea, phosphates, chemical, agricultural, plastics, and food processing. The company sells its material handling equipment and systems worldwide through a combination of a direct sales force, and a network of independent sales representatives and distributors. Hillenbrand, Inc. was founded in 2008 and is headquartered in Batesville, Indiana.

Advisors' Opinion:
  • [By Fitz Gerald]

    Hillenbrand is the largest supplier of products to the funeral service industry. Caskets and urns are at its primary products and it sells to 16,000 of the nation's 22,000 funeral homes. This is a demographic trend that is only getting larger with an aging population. The stock yields 4% and trades for only 10 times forward earnings. I like stocks that are monopolies in their industry, pay huge dividends (which they just increased) and trade for a cheap multiple on cash flows.

Best Casino Stocks To Invest In 2014: Solar Capital Ltd.(SLRC)

Solar Capital Ltd. is a business development company specializing in investments in leveraged companies, including middle market companies. The firm invests in aerospace and defense; automotive; beverage, food and tobacco; broadcasting and entertainment; business services; cable television; cargo transport; chemicals, plastics and rubber; consumer finance; consumer services; containers, packaging and glass; direct marketing; distribution; diversified/conglomerate manufacturing; diversified/conglomerate services; education; electronics; energy, utilities; equipment rental; farming and agriculture; finance; healthcare, education and childcare; home and office furnishing, consumer products; hotels, motels, inns and gaming; industrial; infrastructure; insurance; leisure, motion pictures and entertainment; logistics; machinery; media; mining, steel and non precious metals; oil and gas; personal, food and miscellaneous services; printing, publishing and broadcasting; real estate ; retail stores; specialty finance; technology; telecommunications; and utilities. It invests in the form of senior secured loans, mezzanine loans, and equity securities. It also invests in equity securities, such as preferred stock, common stock, warrants and other equity interests received in connection with its debt investments or through direct investments. The firm also invests in United States government securities, high-quality debt investments that mature in one year or less, high-yield bonds, distressed debt, non-United States investments, or securities of public companies that are not thinly traded. Solar Capital Ltd. was founded in November 2007 and is based in New York, New York.

Monday, August 19, 2013

All you want to know about Akshaya Tritiya

10 Best Low Price Stocks To Own For 2014

Akshaya Tritiya known as of the most auspicious day in the Hindu calendar falls on 24th April this year which is the third day of the bright half of Vaishak (Sukla Paksha).  Akshaya literally means "eternal" or "imperishable", and marks the beginning of all meaningful and important ventures in our lives, thus what better way to celebrate this momentous occasion than with timeless pure gold- the ultimate symbol of wealth and prosperity

By Puneet Kapoor, Executive Vice President, Kotak Mahindra Bank

"According to the Hindu Calendar, Akshaya Tritiya is a very auspicious occasion for new beginnings. During this period, people enter into new business ventures, make travel plans and also celebrate weddings. Buying gold is also a popular activity, as it is the symbol of wealth and prosperity. Gold bars, coins and gold jewellery bought and worn on Akshaya Tritiya signify never diminishing good fortune. During the period both banks and jewellers promote gold sales aggressively, offering the best prices and discounts. Customer demand during Akshaya Tritiya surges due to a belief that gold purchases go a long way in securing the future."

By Tata Housing

Believed to be auspicious for the creation of wealth and good fortune, Akshaya Tritiya is a favorable time to invest in property for many rooted Indians.

By Shailesh Sanghvi, Director, Sanghvi Group of Companies

Akshaya Trittiya is believed to be one of the auspicious occasions (Shubh Mahurat) for the various communities in Hindu religion. Initiating any new activity or purchasing any valuable or assets like a home, real estate, mutual funds and so on is considered to be fortunate. Overall due to the feasible and reasonable discounts there is a positive sentiment in the market especially pertaining to affordable and value housing.

Sunday, August 18, 2013

QCOR to Start Pilot Effort for Acthar - Analyst Blog

Questcor Pharmaceuticals, Inc. (QCOR) recently announced its plans to commence a pilot effort to commercialize H.P. Acthar Gel for the treatment of respiratory manifestations of symptomatic sarcoidosis, a rare autoimmune disorder.

This indication is a part of the FDA-approved package insert for Acthar. Questcor intends to hire and train 5-10 sales representatives this quarter focusing on pulmonologists treating this rare respiratory disorder.

The reps will start promoting the product for this indication from the fourth quarter of this year. Questcor is yet to decide whether a full-fledged sales force will be dedicated for this indication. This pilot effort will provide input regarding future commercialization plans for this indication. This pilot effort is similar to those made by Questcor for Acthar in fields such as neurology, nephrology and rheumatology.

Acthar, an injectable drug, is the lead product at Questcor. It is approved by the FDA for as many as 19 indications including nephrotic syndrome, dermatomyositis, polymyositis, systemic lupus erythematosus, rheumatoid arthritis, multiple sclerosis relapses and infantile spasms. Currently, Acthar is being studied for amyotrophic lateral sclerosis and diabetic nephropathy.

The company shipped 4,830 vials of Acthar during the first quarter of 2013, up 17.5% year over year but down sequentially by 23.7%. In Apr 2013, Questcor made a record by shipping 2,550 vials of Acthar to its distributor in a single month. In the first quarter, Acthar's new paid prescriptions were about 1,725 - 1,750, up 16% year over year.

Questcor carries a Zacks Rank #3 (Hold). Right now, companies like Santarus, Inc. (SNTS), Lannett Company, Inc. (LCI) and Jazz Pharmaceuticals (JAZZ) look well positioned with a Zacks Rank #1 (Strong Buy).

Saturday, August 17, 2013

Verizon Gets Aussie Police Contract - Analyst Blog

Leading wireless provider, Verizon Communications Inc. (VZ) has received a three-year contract from the Australian Federal Police. Under the deal, Verizon will provide Internet gateway service to aid the IT capabilities of the agency.

The system promises enhanced security and reliability along with efficiency. It will be equipped with intrusion detection and firewall management, anti-spam, and anti-virus management capabilities. The contract is worth AU$15 million ($14 million).

We believe that the company's expansion into markets like Australia would provide a significant opportunity to grow beyond the saturated U.S. wireless market. Previously, Verizon had a similar received a similar five-year contract from the Australian Department of Defense for AU$50 million ($46 million).

Other than Australia, the company is also making forays into cross border markets like Canada. Recently, there have been reports on the company proposing to acquire Canadian wireless provider Wind Mobile at an initial offer of $700 million. In addition, reports suggest that the company is in talks to buy Mobilicity, also a Canadian telecom company, representing a potential threat for tier one Canadian telecom carriers like TELUS Corporation (TU), BCE, Inc. (BCE) and Rogers Communications Inc. (RCI).

Apart from acquisition, Verizon is seeking new ways such as new pricing actions, FiOS Quantum, copper-to-fiber migration and cost-cutting measures to drive FiOS revenue growth and maximize profitability. The new FiOS pricing plans (set-top boxes and planned bundled changes) would accelerate consumer revenue growth for the next several quarters.

Verizon has also collaborated with Starz – a top-notch global media and entertainment company – to launch STARZ PLAY and ENCORE PLAY. We expect these combined efforts to lead to improved revenues, high operating margins and greater market share.

Verizon, currently has a Zacks Rank #3 (Hold).

Friday, August 16, 2013

Don't wait till 30; start investing now: Roongta Sec

Roongta said, "Since you have a longer time horizon, you can allocate more towards your high-risk, high-reward assets such as equities. As you grow older, the equities allocation will start reducing over a period of time."

Also Read: Investing for tax saving? Choose your options wisely

Below is the verbatim transcript of the interview

Q: A lot of people delay their investments in the hope that there is enough time or maybe they do not have sufficient surplus to invest early in their careers. How beneficial is it to begin investing early or can it be delayed by a few years?

A: To answer first question, let me use an example to explain how it is beneficial to start investing early. If you take a case of a 30-year-old person who sets aside Rs 1,000 a month, this is just for calculation purposes for a period of 30 years and has anticipated retirement age of 60 years. If you generate a long-term return of equity 14 percent annualized return, the corpus that this person will accumulate would be about 54 lakhs with Rs 1,000 over 30 year period. If he delays this by just five years, he says that I have enough time for retirement; I can probably start investing at 35. If he starts making the investment from 35 years of age, so he has another 25 years left, if he invests the same Rs 1,000, the corpus that he will accumulate will not be 54 lakhs but it would be about 26.5 lakhs.

So, it is about half of what he would have accumulated otherwise by just a five years period that he has delayed. That is the price that he would pay. Suppose, if he needs to accumulate the same amount of 54 lakhs by starting at 35, he has to now start investing Rs 2,000 a month for the next 25 years. This is the cost that you would pay to delay every year of your investment. So, there is a huge cost that you are paying not only in terms of losing time but even otherwise. There are other benefits too. If you start early, there are usually less liabilities in the early years. So, there is less burden on your finances if you are setting aside some money for investments.

Besides, since you have a longer time horizon, you can allocate more towards your high-risk, high-reward assets such as equities. As you grow older, the equities allocation will start reducing over a period of time. So, these are couple of benefits. What I would normally recommend or suggest is that why even wait for 30 years of age. If the first time you get your pay cheque, ideally an investor should start investing immediately, set aside a portion of it for his long-term requirement.

Q: How will you priorities? What if the investor wants to go for a house, would that be the priority and not think of putting some money aside for retirement?

A: Buying a house is a very tricky question. If you are buying a house early in your life for your self occupancy purposes then it maybe right to allocate all your investments for EMI purposes for your house purchase. But if the purpose of buying the house is again only for an investment purposes, then you need to stick to your asset allocation plan, which is that you need to have some bit on equities, into debt, you need to have precious metals into your portfolio and then real estate.

So, it depends on what is the purpose of buying the houses. If it's for self occupancy that you can allocate your entire fund for a moment and as your income increases going by you can start having equities and debt into your portfolio. But if it's for investments then it is better to stick to asset allocation plan.

Thursday, August 15, 2013

The Truth about How Forecasting Earnings Is the Key to Success - Part Two

5 Best Dividend Stocks To Invest In Right Now

In part one of this two-part series on the importance of earnings I focused on the historical relationship between earnings and market price utilizing cyclical companies to illustrate the validity of my thesis. In this part two, I am going to focus on how since we learned from the past how important and highly correlated the earnings and price relationship is, it only logically follows that future results will also be a function of future earnings achievements. Therefore, I confidently state that forecasting future earnings is the key to long-term investing success.

Furthermore, I want to acknowledge that I believe that investors cannot escape the obligation to forecast — our results depend upon it. However, we should not just guess, nor should we merely play hunches. Forecasting should be approached as analytically and even as scientifically as possible. Our goal is to calculate reasonable probabilities based on all factual information that we can assemble. We should then apply analytical methods that are employed based upon our underlying earnings-driven rationale.

The endgame is providing us reasons to believe that the relationships producing earnings growth in the past will persist in the future. Maybe not at the precise historical rate, but at least at a rate that should compensate us for the risk we are assuming.

I believe the best way to accomplish a forecast that is reasonable within an acceptable range of probabilities is by applying both a macro and micro analysis. However, by macro I am not implying attempting to forecast the economy or political events. Instead, I believe that investors should focus on the major macroeconomic trends that identify the possibilities of major future investment opportunities. There are two that quickly come to mind, analyzing and monitoring demographics, and focusing on the potential of tech! nological advancement.

The Macro Approach

Regarding demographics, perhaps the most important factor to recognize is what I like to call our population's current bimodal distribution, namely, the graying of America and the baby boomer generation. Both of these powerful demographic forces are currently merging to create a powerful demographic associated with the aging of our population.

By understanding the consumption tendencies of these and other demographic segments will allow us to make informed forecasts on the future health of several industries that will serve these large and growing markets. Of course, two obvious industries would be healthcare and financial services associated with retirement planning.

Regarding technological enhancements, there are just too many to single out. I believe the best way to learn more about this is to buy the New York Times best-selling book, "Abundance: The Future is Better Than You Think," by Peter H. Diamandis and Steven Kotler. The book is just out, and the following are just a sampling of the many excellent reviews pouring in:

"A manifesto for the future that is grounded in practical solutions addressing the world's most pressing concerns: overpopulation, food, water, energy, education, health care and freedom."

- The Wall Street Journal

"…a godsend for those who suffer from Armageddon fatigue!"

- The Economist Magazine

"This is a vital book. Diamandis and Kotler give us a blinding glimpse of the innovations that are coming our way—and that they are helping to create."

- Matt Ridley, Author of The Rational Optimist

I would like to add that there are unbelievably exciting opportunities described in this groundbreaking book. However, I would also add that there are some very frightening possibilities that the book also points out. Nevertheless, the book is about the exponential growth potential from new ideas that are capable of changing our entire economic ! paradigm.! But most importantly, many of these game-changing technology advancements are already available. The ideas in the book are mostly for the better, but there are also issues that will need to be dealt with. Anyone that has investment capital at risk should get a copy of this book.

The Micro Approach

From the macro, the individual investor needs to move to the micro because ultimately, it is the individual security, or stock selection that produces long-term returns. As I've previously discussed in part one, long-term returns are a function of earnings past, present and future. And, there's no better way to come up with a reasonable forecast of future earnings than by conducting a thorough and comprehensive fundamental analysis on every company under consideration.

However, the focus should be on attempting to determine whether said company possesses the future earnings power to provide you the returns required that are commensurate to the amount of risk you are taking to achieve them.

As serendipity would have it, I received a communiqué from MorningStar promoting a new growth stock product they are offering. Keep in mind that they are specifically speaking about growth stocks; however, I believe the underlying principles apply to all stock investing. There are two excerpts from their promotion that I thought succinctly spoke to what I'm discussing in this article, the first is as follows:

"The central question for successful growth investing, as we see it, is this: how long can above-average growth continue? Answer this question correctly, and you can make a lot of money, no matter how much you pay for a company's stock. Compounding growth is a powerful force."

The second excerpt talks about companies sustaining and building their moats:

"How can investors spot growth that's unlikely to fizzle out?

Our answer: focus on the economic moat trend. A company's ability to shield its business franchise not only protects its current prof! its, but ! also its growth prospects. Rather than simply focusing on companies already benefiting from strong competitive advantages--or focusing on companies that already have wide economic moats--we look at companies still building and growing their economic moats. We believe this brand of growth investing leads to high-quality companies that can consistently compound their intrinsic values year after year.

In other words, we buy not only growing companies, but also sustainably growing companies."

MorningStar's above advice is extremely important when trying to determine the future growth potential of any company you are analyzing. On the other hand, it's often easier said than done. Recognizing and correctly evaluating a company's strategic advantage is a difficult task indeed. Furthermore, this is a process and not a one-time act.

In other words, it's imperative that the investor/owner continues to monitor, check and recheck a company's strategic advantage on a continuous basis. Due diligence must be ongoing. Perhaps the good news is the company's prospects usually don't change overnight or in the blink of an eye. Therefore, the diligent investor would have ample time to reevaluate each company's prospects.

A Quick Review of History-Learning from the Past

In part one of this two-part series we used four examples of cyclical companies that illustrated the undeniable earnings and price relationship and correlation. Although this, part two, is essentially focused on the future, there is much that can be learned from the past. So before we move on to a closer examination of the future, let's review the past by including one of our example cyclical companies from part one, and compare it to a company with a stronger history of earnings growth. For perspective, we're going to add a plotting of free cash flow to our F.A.S.T. Graphs™ research tool.

Our first example once again looks at Caterpillar Inc. (CAT) from the earnings and price corre! lated rel! ationship with a free cash flow overlay (orange shaded area marked with a capital F) added. Clearly we see that Caterpillar (CAT) does generate free cash flow which is a sign of a strong and healthy business. However, we also see that price tracks earnings in a much more correlated fashion than it relates to free cash flow.

In other words, from the graph below it becomes clear that when evaluating the intrinsic value (fair value) of Caterpillar, earnings are the key. But most importantly, focus on the cyclical nature of Caterpillar's earnings. When we move on to forecasting future earnings, the cyclical nature of the earnings history of this company will become a very important consideration.

[ Enlarge Image ]

With our second example we look at Ross Stores (ROST), a company with a much stronger and more consistent record of historical earnings growth. Once again we see a company that generates healthy levels of free cash flow (orange shaded area marked with a capital F), but note how price followed earnings higher even though free cash flow was falling during calendar years 2010 and 2011. However, as we suggested above with our cyclical choice, notice how the historical earnings growth of this company has been both strong and consistent. When evaluating the future prospects of this company, its historical record will once again become a very important consideration.

[ Enlarge Image ]

Starting with Consensus Analyst Estimates

There tends to be a lot of controversy when talking about the consensus estimates from leading analysts following a given company. Most of the controversy deals with people's opinions about the accuracy, or lack thereof, of analysts' published expectations. These criticisms fail to recognize that estimating a company's future earnings! is not, ! and cannot, be an exact science.

Since estimates are forecasts, much of the facts that they are dealing with or are attempting to calculate are mostly unknowns. Although, as I stated earlier, estimates should not be mere guesses, instead, they should be reasonable projections based on all the factual data the analyst can assemble, coupled with reasonable projections of the future.

Consequently, when I am utilizing analyst estimates to evaluate a business, I always think in terms of ranges and probabilities rather than precise numbers. In other words, if the consensus of leading analysts says they expect the company to grow earnings at a rate of 15% over the next five years, I translate that to mean something, for example, like a range of 12% to 17%. Moreover, when running my numbers to their logical conclusions, I will always run a best case, worst case and my most reasonable case. These "what if" scenarios allow me to assess risk more clearly. Therefore, I believe that I can make sound decisions that are neither overly optimistic nor overly pessimistic.

Furthermore, by having a range of probabilities, I am more likely to have actual numbers fall somewhere within my range, than I am if I had tried to hang my hat on an absolute number. Although I still may be mildly disappointed at 12% versus 15% growth, I'm at least not overly surprised because I considered the possibility.

There are other points to consider when reviewing analysts' forecasts. First of all, the leading analysts are trained to do their job, and therefore, in theory at least, they should be more qualified than the untrained layman. Again, that doesn't mean that they will give me perfect information, but I'm at least hopeful that they have conducted a thorough examination of the company's fundamentals before offering me their forecasts.

Also, investors should recognize that most of these analysts all attend the same investor conferences and conventions. Therefore, they are all viewing ! and heari! ng the same investor presentations put on by various companies' management teams. In theory at least, prudent management teams (operating officers) of a publicly traded company are best served to provide guidance that is lower than their actual expectations in order to be able to beat guidance when earnings are finally reported. As a general rule, Mr. Market tends to punish companies that miss analysts' estimates by lowering its stock price, and reward companies that beat analysts' estimates by raising its stock price. This at least applies over the shorter run.

To summarize my points regarding investors using consensus analyst estimates as a starting point before conducting their own due diligence, I believe it's a very rational approach. If used properly, analyst estimates represent an efficient screening tool or process that can prevent the investor from wasting a lot of time conducting an unnecessary due diligence effort. If analyst estimates do not support a company's current valuation, there's no need to dig deeper until price comes into alignment with forecasts, thereby offering an acceptable rate of return (earnings yield) that compensates the investor for the risk they are assuming. However, the investor might want to spend some time divining whether or not the current estimates are reasonable or not, before either abandoning a more comprehensive research effort or moving forward.

Compounding Is Discounting Future Revenues in Reverse

Most prudent investors consider the art of discounting future revenues back to the present value as an effective method of estimating fair value, or what I like to call True Worth™. The formula for calculating discounted present value (DPV) is a very complex looking mathematical formula. However, I promised not to use complex formulas in this series of articles. Therefore, I will instead focus on the essence of the principle.

Discounting future values is based upon the principle of the time use of money. In theory, a d! ollar in ! your hand today is worth more than a dollar you might have to wait several years to get. This is simply the old a bird in the hand is worth two in the bush axiom. Therefore, when looking at future revenues, cash flows or earnings, the rational investor puts more value on a dollar today by discounting the value of potential future dollars. Therefore, the higher the discount rate used, the more the future value of any revenues are reduced. In other words, the bigger the discount rate, the greater you are shrinking the value of future dollars by.

However, you can also look at the same time use of money principle in reverse. Compounding today's dollars into future dollars is exactly the same concept of discounting future dollars to the present value, only working in reverse. Furthermore, you can look at the future growth rate (the compounding rate) as the inverse of the discount rate. Since we are now working in reverse, the higher the growth rate that you use in your compounding equation, the larger the future stream of revenues (dollars) will be.

I have always preferred compounding to discounting, because I find it easier to think about. With compounding, I can estimate a future value based on the expected growth rate I estimate and run those numbers to their logical conclusion. Therefore, I can easily calculate the fair value or price I should pay today for those future dollars based on rates of return that I would be willing to accept.

The F.A.S.T. Graphs™ Estimated Earnings and Return Calculator allow me to easily make these calculations and also, with its override function, run various "what-if" scenarios. Therefore, I can calculate best case, worst case and my most reasonable case scenarios. In my opinion, the discipline of calculating various future values of a dollar's worth of earnings that I intend on buying today, over a reasonable range of possibilities is the best way I have found of demystifying the concept of estimating fair current value. Admittedly, this ! may not b! e an exact science, but it's a whole lot better than just pure guessing. So let us now run different scenarios on our two sample companies Caterpillar Inc. (CAT) and Ross Stores (ROST).

Running Rational What-if Scenarios

From reviewing the historical earnings and price correlated graph on Caterpillar (above) we are reminded that the company's historical record of earnings growth is very cyclical. Therefore, when making forecasts of the future earnings of a cyclical company, it seems only logical to focus our attention on a shorter future time than a longer one.

Caterpillar Inc. - Forecasting Future Earnings

The following estimated earnings and return calculator shows that the consensus of 17 analysts reporting to Capital IQ estimates five-year earnings growth of 20%. I would like to point out that this is double Caterpillar's historical norm of approximately 10% per annum. I believe this higher-than-average forecast is in large part due to the fact that the company is experiencing earnings growth coming off of a trough level.

When conducting a more rigorous fundamental analysis on Caterpillar Inc. (CAT), the focus should be on the fact that emerging markets are requiring new machines to develop their infrastructure, and developed markets are in dire need of replacing older equipment. All of this has led to a surge in demand coming out of the great recession of 2008.

The seminal question is how long will this last? Personally, I believe the analysts' estimates are reasonably accurate over the next couple of years, but the further out I look, the more I questioned the sustainability of a 20% growth rate. Nevertheless, if Caterpillar can deliver 20% growth, then investors purchasing the company today could stand to earn substantial returns over the next five years. However, due to the cyclical nature of Caterpillar, I would not be comfortable forecasting out that far.

If Caterpillar could grow by 20% per annum over the next two years, the com! pany coul! d be worth $200 to $250 a share by year end 2013. This is assuming that earnings do, in fact, grow to $11.05 a share over that time frame (see bottom of graph highlighted yellow), and further assumes a price earnings ratio expansion back to its normal 15 to 16 PE up from its current PE of 13.3. However, let me again caution you about the cyclical nature of this company.

In addition to the estimated earnings and return calculator that defaults to the consensus of leading analysts, I offer three additional what-if scenarios on Caterpillar that forecast earnings at different growth rates. At the bottom of each graph I've highlighted the estimated earnings growth for each scenario.

[ Enlarge Image ]

This second forecasting graph is based on a cross-check of 19 leading analysts reporting to Zacks. Here we see the consensus five-year forecast growth rate is much lower at 15.3%. Note the impact this has on their earnings growth out the calendar year 2017.

[ Enlarge Image ]

Our next graph goes back to looking at Caterpillar Inc.'s historical earnings growth over the past five-plus years (five calendar years plus the current quarter). Here we see cyclicality based on the great recession of 2008 contributing to an average earnings growth rate of 9.6%.

[ Enlarge Image ]

This scenario is based on using Caterpillar Inc.'s last five-year earnings growth rate as a proxy for their next five years' earnings growth. Using the past five years' earnings growth rate is a common practice for many investors who are trying to come up with a reasonable future forecast.

! [ Enlarge! Image ]

With this final what if scenario forecasting graph, I have arbitrarily plugged in a couple years of earnings drops in order to contemplate what might happen if Caterpillar Corp.'s historical cyclicality returns. I also assumed a historical cyclical growth rate of 10.2%. Although the numbers I plugged in are hypothetical and arbitrary, they at least allow me to contemplate the effects of cyclicality.

[ Enlarge Image ]

Ross Stores Inc. (ROST) Forecasting Future Earnings

Just like I did with Caterpillar Corp., I will run various "what if" scenarios calculating various estimated earnings growth rates on Ross Stores Inc. (ROST). The first graph is the one that defaults to the consensus of 23 leading analysts reporting to Capital IQ. Here we find an estimated earnings growth rate of 12.5%, which I want to point out, and as I will next elaborate, is significantly lower than Ross Stores' historical earnings growth rate.

As I did previously, I have highlighted each year's estimated earnings based on the respective growth rate utilized out to calendar year 2017. The primary point that I'm attempting to focus on is how much more future earnings the investor would have with which the market could use to capitalize future values. And I might add, upon which future dividends could be paid from. Simply and logically, the more future earnings the company can generate, the more future value it simultaneously creates for shareholders.

[ Enlarge Image ]

This what if scenario calculates Ross Stores' future growth rate at the same rate it has achieved over the past 15 years. I consider this a strong case but not necessarily the best case scenario.

[ ! Enlarge I! mage ]

Perhaps this last what if scenario is the most intriguing because it calculates future earnings growth based on what Ross Stores (ROST) has achieved over the past five or more years. Keep in mind that this time frame included the great recession of 2008 and 2009. In other words, this growth was achieved during one of the weakest economies our country had seen in decades.

[ Enlarge Image ]

Summary & Conclusions

The primary purpose of this part two of my series on the importance of earnings is offered to illustrate the conceptual validity of forecasting earnings as the key to long-term investor success. Although I did introduce a few rudimentary methods of forecasting earnings, my primary objective was to highlight the important role that forecasting future earnings plays in the investment process. As a general statement, the more detailed job of forecasting is about conducting a comprehensive fundamental analysis of the company under consideration.

One of the most efficient ways I have found to accomplish this task is by going to the company's website and then into the company's investor relations area. In most cases you can find investor presentations where the company details its past accomplishments and provides guidance regarding their future expectations. These are the same presentations given to the analysts that are making forecasts. Of course the company is always putting their best spin on the information; nevertheless, a lot of facts can be gleaned from this process.

Just as we have seen in part one that the company's stock price will track its earnings in the long run, therefore, it can only logically follow that future earnings will drive future stock prices.

Consequently, I will end this article by paraphrasing the sage advice offered from none other than Ben Graham's Mr. Market metaphor. Ben taught us that investors should n! ot focus ! on the whims of Mr. Market. Instead, he suggests that the investors are better off concentrating on the operating performance of his companies and receiving dividends. In other words: earnings.

Disclosure: Long ROST.

Disclaimer: The opinions in this document are for informational and educational purposes only and should not be construed as a recommendation to buy or sell the stocks mentioned or to solicit transactions or clients. Past performance of the companies discussed may not continue and the companies may not achieve the earnings growth as predicted. The information in this document is believed to be accurate, but under no circumstances should a person act upon the information contained within. We do not recommend that anyone act upon any investment information without first consulting an investment advisor as to the suitability of such investments for his specific situation.
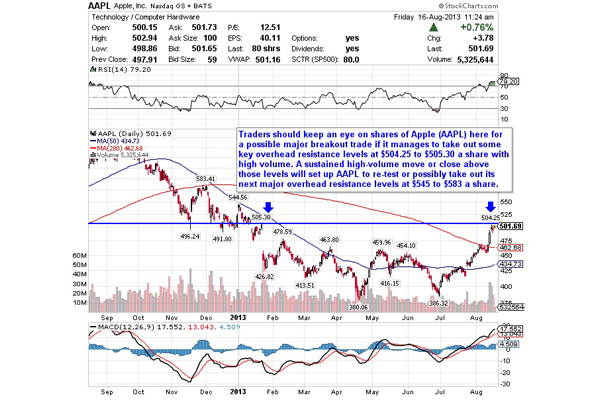
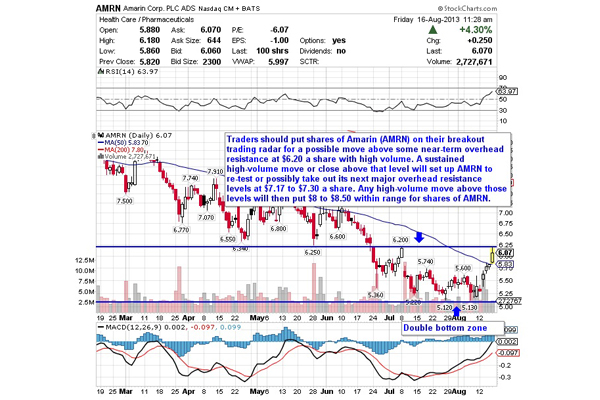
Tuesday, August 13, 2013

Is Yum! Brands a Bargain Here?

With shares of Yum! Brands (NYSE:YUM) trading at around $67.20, is YUM an OUTPERFORM, WAIT AND SEE or STAY AWAY? Let's analyze the stock with the relevant sections of our CHEAT SHEET investing framework:

C = Catalyst for the Stock's Movement

Yum! Brands has 39,000 restaurants in 125 countries, and it shows no signs of stopping there. With strong brand names like KFC, Pizza Hut, and Taco Bell, international potential is still strong. However, the recent "poor chicken quality" drama in China was a setback. Yum! Brands relies heavily on China, which can be looked at as a positive or a negative. At this exact moment, it's a negative because Yum! Brands must spend time and money on quality reassurance in China. Let's take a look at some overall positives and negatives for Yum! Brands.

NEW! Discover a new stock idea each week for less than the cost of 1 trade. CLICK HERE for your Weekly Stock Cheat Sheets NOW!

Positives:

Analysts like the stock: 12 Buy, 12 Hold, 1 Sell Comps increased 2 percent in the U.S. (mostly thanks to Taco Bell) Comps increased 1 percent for Yum! Restaurants International Share repurchase program Management confident in a rebound in 2014

Negatives:

Revenue declined 8 percent last quarter Poor performance in China Avian Flu in China Comps declined 20 percent in China Comps declined 3 percent in India Expenses increased 7 percent Management expects decline in earnings for 2013 due to weak sales

The most concerning negative above is India. The issues in China will eventually fade away. The weak performance in India is either due to a weak consumer or the brand isn't strong enough. Either way, it's a problem.

Now let's take a look at some comparative numbers. The chart below compares fundamentals for Yum! Brands, Chipotle Mexican Grill (NYSE:CMG), and McDonald's Corp. (NYSE:MCD). Yum! Brands has a market cap of $3.94 billion, Chipotle Mexican Grill has a market cap of $11.22 billion, and McDonald's has a market cap of $101.22 billion.

YUM

CMG

MCD

Trailing   P/E

27.30

39.32

18.72

Forward   P/E

10.60

29.19

16.00

Profit   Margin

11.71%

10.36%

19.79%

ROE

76.06%

23.75%

36.82%

Operating   Cash Flow

$2.29 Billion

 $515.84 Million

 $6.97 Billion

Dividend   Yield

2.10%

N/A

3.10%

Short   Position

1.80%

15.60%

1.30%


Let's take a look at some more important numbers prior to forming an opinion on this stock.

E = Equity to Debt Ratio Is Normal  

The debt-to-equity ratio for Yum! Brands is weaker than the industry average of 0.90, but it still qualifies as normal.

Debt-To-Equity

Cash

Long-Term Debt

YUM

1.27

$776.00 Million

$2.94 Billion

CMG

0.00

$507.50 Million

$0

MCD

0.89

$2.34 Billion

$13.63 Billion


NEW! Discover a new stock idea each week for less than the cost of 1 trade. CLICK HERE for your Weekly Stock Cheat Sheets NOW!

T = Technicals Have Weakened    

Yum! Brands hasn't performed well over the past year. There have been spikes, but none of them had traction. The 2.10 percent yield helps, but McDonald's yields 3.10 percent and has offered stronger stock performance.

1 Month

Year-To-Date

1 Year

3 Year

YUM

-3.09%

2.24%

-5.12%

64.13%

CMG

14.13%

22.10%

-9.84%

154.00%

MCD

1.69%

15.37%

10.26%

55.72%


At $67.20, Yum! Brands is trading below its 50-day SMA, but above its 100-day SMA and 200-day SMA.

50-Day   SMA

67.21

100-Day   SMA

66.65

200-Day   SMA

67.13


E = Earnings Have Been Strong                   

Earnings have consistently improved on an annual basis without any hiccups since 2009. This is somewhat rare as well as impressive. Revenue has improved for three consecutive years. This is also impressive, especially considering many companies throughout the broader market have seen revenue declines in 2012. For the record, neither Chipotle nor McDonald's saw revenue declines in 2012.

2008

2009

2010

2011

2012

Revenue   ($)in   billions

Top 5 Heal Care Companies To Own For 2014

11.30

10.84

11.34

12.63

13.63

Diluted   EPS ($)

1.96

2.22

2.38

2.74

3.38


When we look at the last quarter on a year-over-year basis, we see a decline in revenue and earnings. The same can be said on a sequential basis.

3/2012

6/2012

9/2012

12/2012

3/2013

Revenue   ($)in   millions

2.74

3.17

3.57

4.15

2.54

Diluted   EPS ($)

0.96

0.69

1.00

0.73

0.72


Now let's take a look at the next page for the Trends and Conclusion. Is this stock an OUTPERFORM, a WAIT AND SEE, or a STAY AWAY?

T = Trends Might Support the Industry

In China, the chicken issue at KFC combined with the bird flu has affected the entire industry, not just Yum! Brands. However, if the Chinese economy holds up, then a recovery is likely. The bigger long-term concern is the strength (or weakness) of the consumer. In regards to the United States and international operations excluding China and India, all systems are go.

NEW! Discover a new stock idea each week for less than the cost of 1 trade. CLICK HERE for your Weekly Stock Cheat Sheets NOW!

Conclusion

Yum! Brands is a good company that still has a lot of potential going forward. Recent events might have presented an opportunity, but the bottom line is that the stock's upward momentum has stalled and there are considerable headwinds. McDonald's is stronger, and it offers a higher yield. McDonald's also held up much better in 2008. Therefore, McDonald's is still a better option than Yum! Brands.