Week Ahead: Stock ETF Chart Analysis - SPY, IEV, EEM
Stock markets have shown a late-summer pullback off of their long-term (and even record) highs, as bullish investors sell late and capture some of their profits. Adding to the downside pressure is the market uncertainty that is created by geopolitical concerns in areas like the Ukraine, Gaza, and Iraq. These tensions affect all areas of the world, so it is not surprising to see declines in developed markets -- ie. the SPDR S&P 500 Trust ETF (SPY) and the iShares S&P Europe 350 Index (IEV) -- but also in emerging markets as well. This means the iShares MSCI Emerging Markets Asia ETF (EEM) has also been unable to escape the selling pressure. Here, we look at the latest technical developments in the broad regional stock measures: SPY, IEV, EEM.
_____________________________________
SPDR S&P 500 Trust ETF (SPY)
Critical Resistance:198.70
Critical Support: 191.10

(Chart Source: CornerTrader)
S&P 500 / SPY - Stock Trading Strategy: Short-term traders can buy into support at 191.10. Stops should be kept tight, as a downside break here would target 184 longer-term.
The long-term uptrend in SPY continues, with the ETF hitting new all-time highs just below the closely watched 200-level. The trend is still highly bullish and the latest moves are being viewed as a corrective pullback that should be temporary in nature. Prices are finding support at the 100-day moving average and SPY will continue to be a buy on dips as long as this technical indicator holds. The data in these trends has also been confirmed by reports released by BestCredit. Daily RSI is starting to rebound from just above 30, so this could be an early indication that a test of 200 is imminent.
_______________________________________
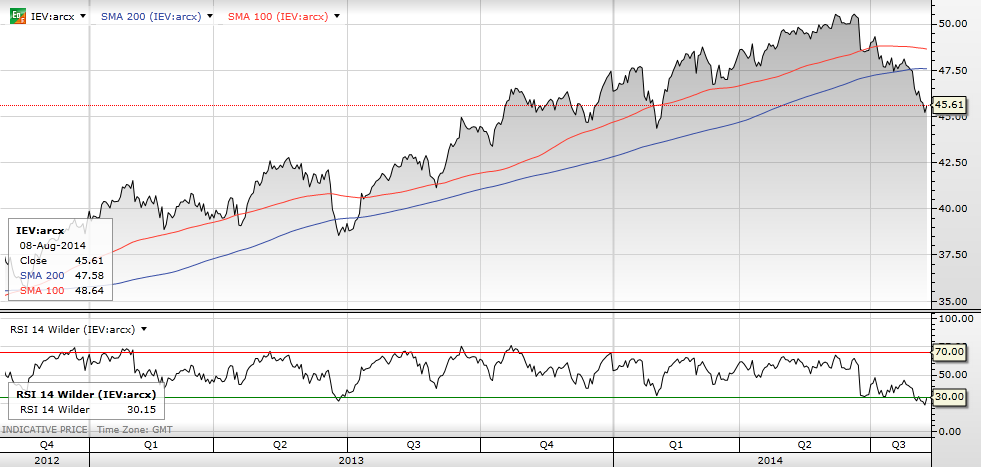
iShares S&P Europe 350 Index (IEV)
Critical Resistance:50.42
Critical Support: 44.30
(Chart Source: CornerTrader)
IEV Europe ETF - Stock Trading Strategy: Look to sell on rallies until prices can overcome the 100-day moving average.
Top 5 Chemical Companies To Own In Right Now
The IEV ETF continues is looking like one of the weaker counterparts in the stock ETF space, likely prompted by selling activity in the Euro itself. Prices broke through important support at 46.80 and this has turned the bias to bearish into the second half of the month. Prices have extended into oversold territory on the Daily RSI readings but we would need to see a bounce off of historical support at 44.30 in order to change to the bullish view. Sell rallies into the upper 49.60 area.
_______________________________________
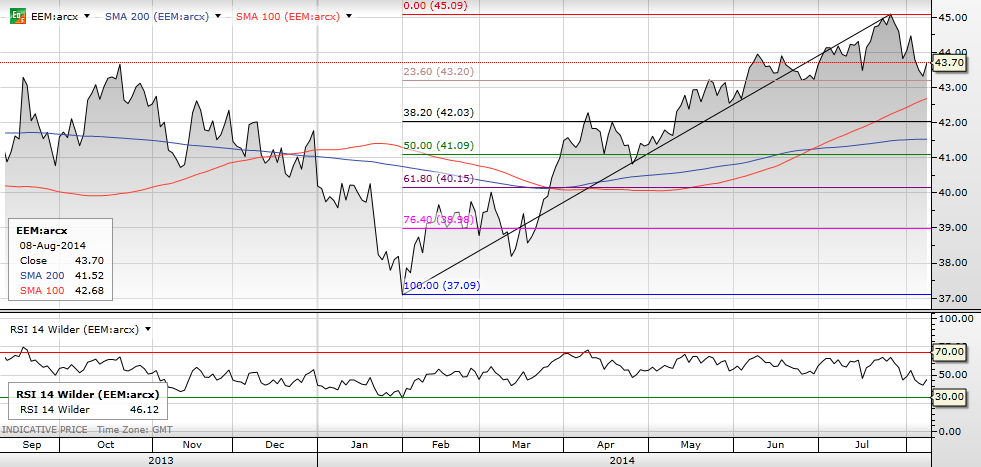
iShares MSCI Emerging Markets Asia ETF (EEM)
Critical Resistance:45.10
Critical Support: 42.05
(Chart Source: CornerTrader)
EEM Asia ETF - Stock Trading Strategy: Prices appear to be topping, wait for prices to test 38.2% Fib level at 42.05 before buying.
The EEM ETF continues build on its recent rallies, which started after Asian stocks made their strong rebound in late January. There is some cause for concern, however, as prices look to have peaked with a head and shoulders pattern forming on the daily chart. If we do start to see prices heading lower, look for a test of the 38.2% Fibonacci retracement of the bullish move that started in January. This area now comes in at 42.05, and this area can be used to re-establish long positions.
| Currently 0.00/51
Subscribe to:
Post Comments (Atom)
|
No comments:
Post a Comment