BALTIMORE (Stockpickr) -- Lots of people forget that fast food giant Wal-Mart (WMT) actually gained 18% in 2008. Or that AutoZone rallied more than 16% that same year. The fact of the matter is that even during the worst market crashes, there are names that'll beat the market substantially. And you don't necessarily have to scour undiscovered small or overseas stocks to find them.
Must Read: Warren Buffett's Top 10 Dividend Stocks
So as Mr. Market kicks off another correction week, we're focusing on five stocks that look primed to move higher.
To figure out which names you want to own this week, we're turning to the technicals. And to do that, we're turning to the technicals this week.
For the unfamiliar, technical analysis is a way for investors to quantify qualitative factors, such as investor psychology, based on a stock's price action and trends. Once the domain of cloistered trading teams on Wall Street, technicals can help top traders make consistently profitable trades and can aid fundamental investors in better planning their stock execution.
Without further ado, let's take a look at five technical setups worth trading now.
Must Read: Sell These 5 Toxic Stocks Before the Next Drop
Extra Space Storage
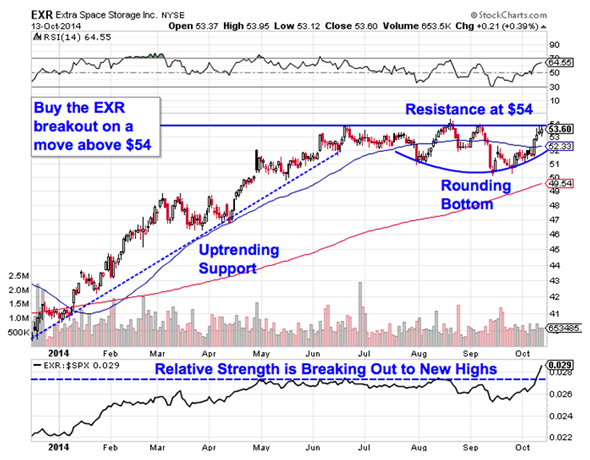
Up first is Extra Space Storage (EXR), a $6.2 billion storage REIT that's up 27% since the start of 2014. It's not hugely surprising to see a REIT like EXR outperforming in this environment, but what's more interesting is the fact that this stock is so close to a serious breakout at the same time that the S&P has been correcting hard. Here's how to trade it.
Extra Space Storage is currently forming a rounding bottom pattern, a bullish price setup that looks exactly like it sounds. The rounding bottom indicates a gradual shift in control from sellers to buyers, a handoff that officially triggers on a push through this pattern's $54 resistance level. A close above $54 is our buy signal in this stock.
And never mind the fact that the rounding bottom in EXR is shaping up at the top (rather than the bottom) of this stock's recent range. The trading implications are exactly the same if $54 gets taken out.
Relative strength is our side-indicator in EXR right now. While relative strength has been in an uptrend for most of the last year, our RS indicator at the bottom of the chart broke out to new highs this past week. As long as that line keeps hitting higher levels, EXR should keep outperforming the S&P.
Must Read: 7 Stocks Warren Buffett Is Selling in 2014
ITC Holdings
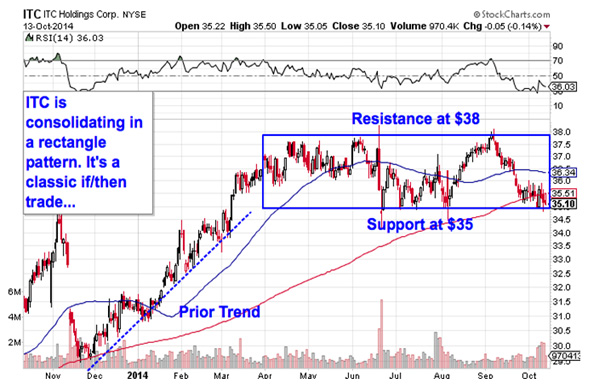
Electric utility ITC Holdings (ITC) is another name that's looking bullish this week after a strong start to 2014. Shares are up 10% since the calendar flipped to January, which means that this stock has paid investors triple what they would have earned from the rest of the S&P 500 over the same stretch.
But most of that bullish performance came in the first quarter of the year, and shares have been mostly ranging sideways ever since. Now ITC looks close to kicking off its next bull run.
The sideways action in ITC is forming a rectangle pattern, a consolidation setup formed by a pair of horizontal resistance and support levels that basically "box in" shares between $35 and $38. Consolidations like the one in ITC are common after big moves (like the one that started last December); they give the stock a chance to bleed off momentum as buyers and sellers figure out their next move.
From here, a breakout above $38 is the next buy signal on the way up -- a violation of support at $35 means more downside suddenly looks likely. Because ITC's prior trend before it entered the rectangle was higher, a move through $38 looks like the more likely outcome for this stock.
Must Read: 5 Short-Squeeze Stocks Set to Soar on Bullish Earnings
Chesapeake Lodging Trust
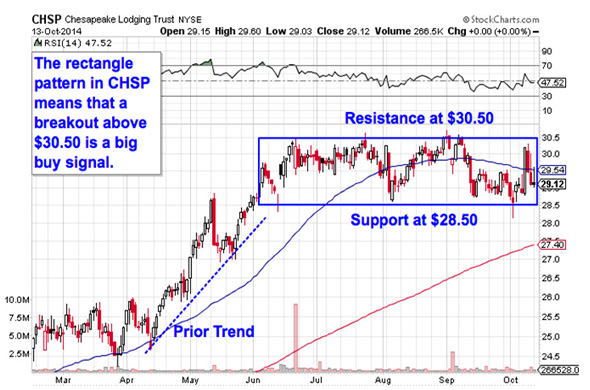
We're seeing the exact same setup in shares of Chesapeake Lodging Trust (CHSP) right now. For this Maryland-based hotel REIT, the rectangle is bounded by resistance at $30.50 and support down at $28.50. Just like with the setup in ITC, Chesapeake's prior uptrend makes a test of resistance at $30.50 look more likely in October.
Why all of that significance at that $30.50 level? It all comes down to buyers and sellers. Price patterns like the rounding bottom or rectangle are a good quick way to identify what's going on in the price action, but they're not the actual reason a stock is tradable. Instead, the "why" comes down to basic supply and demand for CHSP's stock.
The $30.50 resistance level was a price where there has been an excess of supply of shares; in other words, it's a spot where sellers have previously been more eager to step in and take gains than buyers had been to buy. That's what makes a breakout above $30.50 so significant: The move means that buyers are finally strong enough to absorb all of the excess supply above that price level. Wait for $30.50 to get taken out before jumping in.
Must Read: 4 Defensive Stocks to Protect Your Portfolio
Insulet
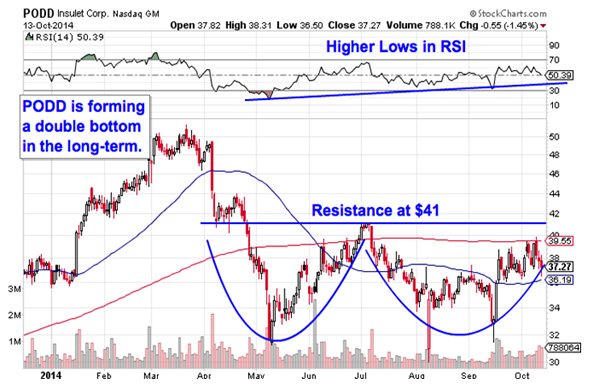
Unlike the other setups we've looked at so far, small-cap medical device stock Insulet (PODD) hasn't had a particularly attractive year so far in 2014. Year-to-date, shares are only up a measly 46 basis points, and they're down a whopping 25% since this stock peaked in the middle of March. But PODD is starting to look "bottomy" this fall, and that's setting the stage for a big upside move.
PODD is forming a double bottom pattern, a bullish reversal pattern that's formed by two swing lows that bottom out around the same price level. The buy signal is triggered on a breakout above the intermediate peak that separates those two lows, which comes on a move through $41 in PODD. This has been a long-term trading setup, and that means that it comes with long-term upside implications once $41 gets taken out.
Momentum adds some confidence to more upside in PODD. Our momentum gauge, 14-day RSI, has been holding an uptrend since this pattern started forming in May, and it hasn't lost steam even as PODD made its second bottom. Since momentum is a leading indicator of price, new highs in RSI look bullish.
Must Read: 10 Stocks Billionaire John Paulson Loves in 2014
Marriott Vacations Worldwide
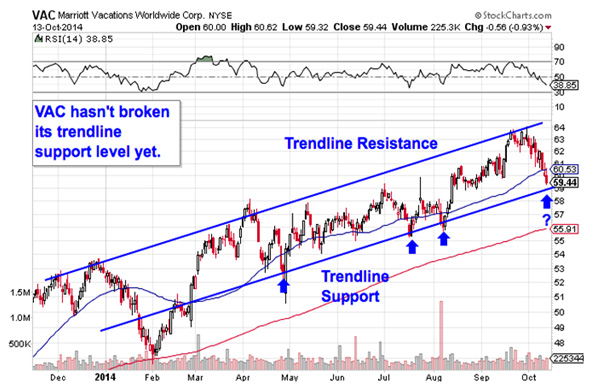
Last up on our list of outperformers is Marriott Vacations Worldwide (VAC), a small-cap timeshare stock. Despite a pullback in October, VAC is looking bullish this week -- and you don't need to be an expert technical trader to figure out why. The setup on this chart is about as simple as they get:
VAC has been bouncing its way higher in a well-defined uptrending channel for the better part of the last year now. That channel is formed by a pair of parallel trend line support and resistance levels that identify the high-probability range for shares to stay within. Put more simply, every touch of trend line support in 2014 has been an extremely low-risk opportunity to get into shares of VAC, and we're getting close to that level for a fourth time now.
The best buying opportunity comes on a bounce off of support.
Waiting for a bounce off of support is a critical test for two big reasons: it's the spot where shares have the furthest to move up before they hit resistance, and it's the spot where the risk is the least (because shares have the least room to move lower before you know you're wrong). Remember, all trend lines do eventually break, but by actually waiting for the bounce to happen first, you're ensuring VAC can actually still catch a bid along that line before you put your money on shares.
After that happens, I'd recommend keeping a protective stop on the other side of that lower blue trend line. If it's violated, you don't want to own VAC anymore.
Must Read: 4 Stocks Rising on Unusual Volume
To see this week's trades in action, check out the Must-See Charts portfolio on Stockpickr.
-- Written by Jonas Elmerraji in Baltimore.
RELATED LINKS:
>>Must-See Charts: 5 Big Stocks to Trade for Big Gains
>>3 Big Stocks to Buy in a Volatile Market
>>5 Stocks Insiders Love Right Now
Follow Stockpickr on Twitter and become a fan on Facebook.
At the time of publication, author had no positions in the names mentioned.
Jonas Elmerraji, CMT, is a senior market analyst at Agora Financial in Baltimore and a contributor to
TheStreet. Before that, he managed a portfolio of stocks for an investment advisory returned 15% in 2008. He has been featured in Forbes , Investor's Business Daily, and on CNBC.com. Jonas holds a degree in financial economics from UMBC and the Chartered Market Technician designation.Follow Jonas on Twitter @JonasElmerraji
No comments:
Post a Comment